Pythonで近似曲線を描く
Rでやった事をPythonでもやる。
準備
- scipy
- numpy
ライブラリはこの辺を使う。データも前回同様気象庁のデータを使います。
ライブラリの準備
import pandas as pd
from matplotlib import pyplot as plt
import seaborn as sns
import numpy as np
from scipy import optimize as opt
データを読み込みと確認
kion = pd.read_csv("kion_20160501.csv")
kion.head()
やはりこんな感じで内容が得られる。pandasマジ便利
| time | temp | |
|---|---|---|
| 0 | 2016-05-01 00:00 | 13.9 |
| 1 | 2016-05-01 01:00 | 13.9 |
| 2 | 2016-05-01 02:00 | 12.3 |
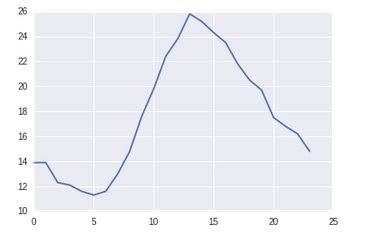
早速プロット
Px = np.arange(0, len(kion), 1)
Py = kion['temp']
plt.plot(Px, Py)
plt.show()

今回もこのプロットに対して近似曲線を描く
scypi.optimize.curve_fitを使う
例によって上記のモデルの変数a, b, c, dについて計算ができるのがcurve_fit関数。ドキュメントをみるとこんな感じで使えとある。
scipy.optimize.curve_fit — SciPy v0.17.0 Reference Guide
Assumes ydata = f(xdata, *params) + eps Parameters:
f : callable
The model function, f(x, ...). It must take the independent variable as the first argument and the parameters to fit as separate remaining arguments.xdata : An M-length sequence or an (k,M)-shaped array
for functions with k predictors. The independent variable where the data is measured.ydata : M-length sequence
The dependent data — nominally f(xdata, ...)
引数にcallableな関数を渡せと。あとは普通にXデータとYデータ。ということでこんな感じでコーディング。
def fit_func(x, a, b, c, d):
    return a * x**3 + b * x**2 + c * x + d

res = opt.curve_fit(fit_func, Px, Py)
このモデルに限らず引数とか関数とかを任意に変えてcurve_fitに渡すことで、使い方を変える。
それで、変数a, b, c, dについてはこんな感じで得られる。
a = res[0][0]
b = res[0][1]
c = res[0][2]
d = res[0][3]
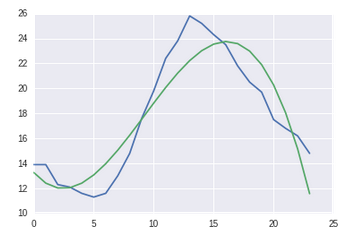
a, b, c, dをもとに近似曲線のyを計算
Px2 = []
for x in Px:
    Px2.append(a * x**3 + b * x**2 + c * x + d)
そしてプロット
plt.plot(Px, Py)
plt.plot(Px, np.array(Px2))
plt.show()

Rで計算した値とPythonで計算した値はそれぞれこんな感じ。微妙に差がありますが、ほぼオーケーかと。そもそも近似曲線に正確性を求めるものでもないですし。
| R | Python | |
|---|---|---|
| a | -0.0092 | -0.0092 |
| b | 0.2859 | 0.2580 |
| c | -1.6403 | -1.0963 |
| d | 14.6270 | 13.2633 |